
Most CRM systems are very good at storing data — and far less effective at helping sales managers and executives interpret it quickly.
SuiteCRM is no exception.
While SuiteCRM has solid reporting capabilities, it’s not always easy to answer questions like:
- Are reps actually generating activity — or just logging calls?
- Is the pipeline growing fast enough to support next month or next quarter?
- Are we trending up or down compared to last year?
- Where are leads really coming from right now?
That’s the gap this SuiteCRM Sales Dashboard plugin is designed to close.
Watch the video walkthrough
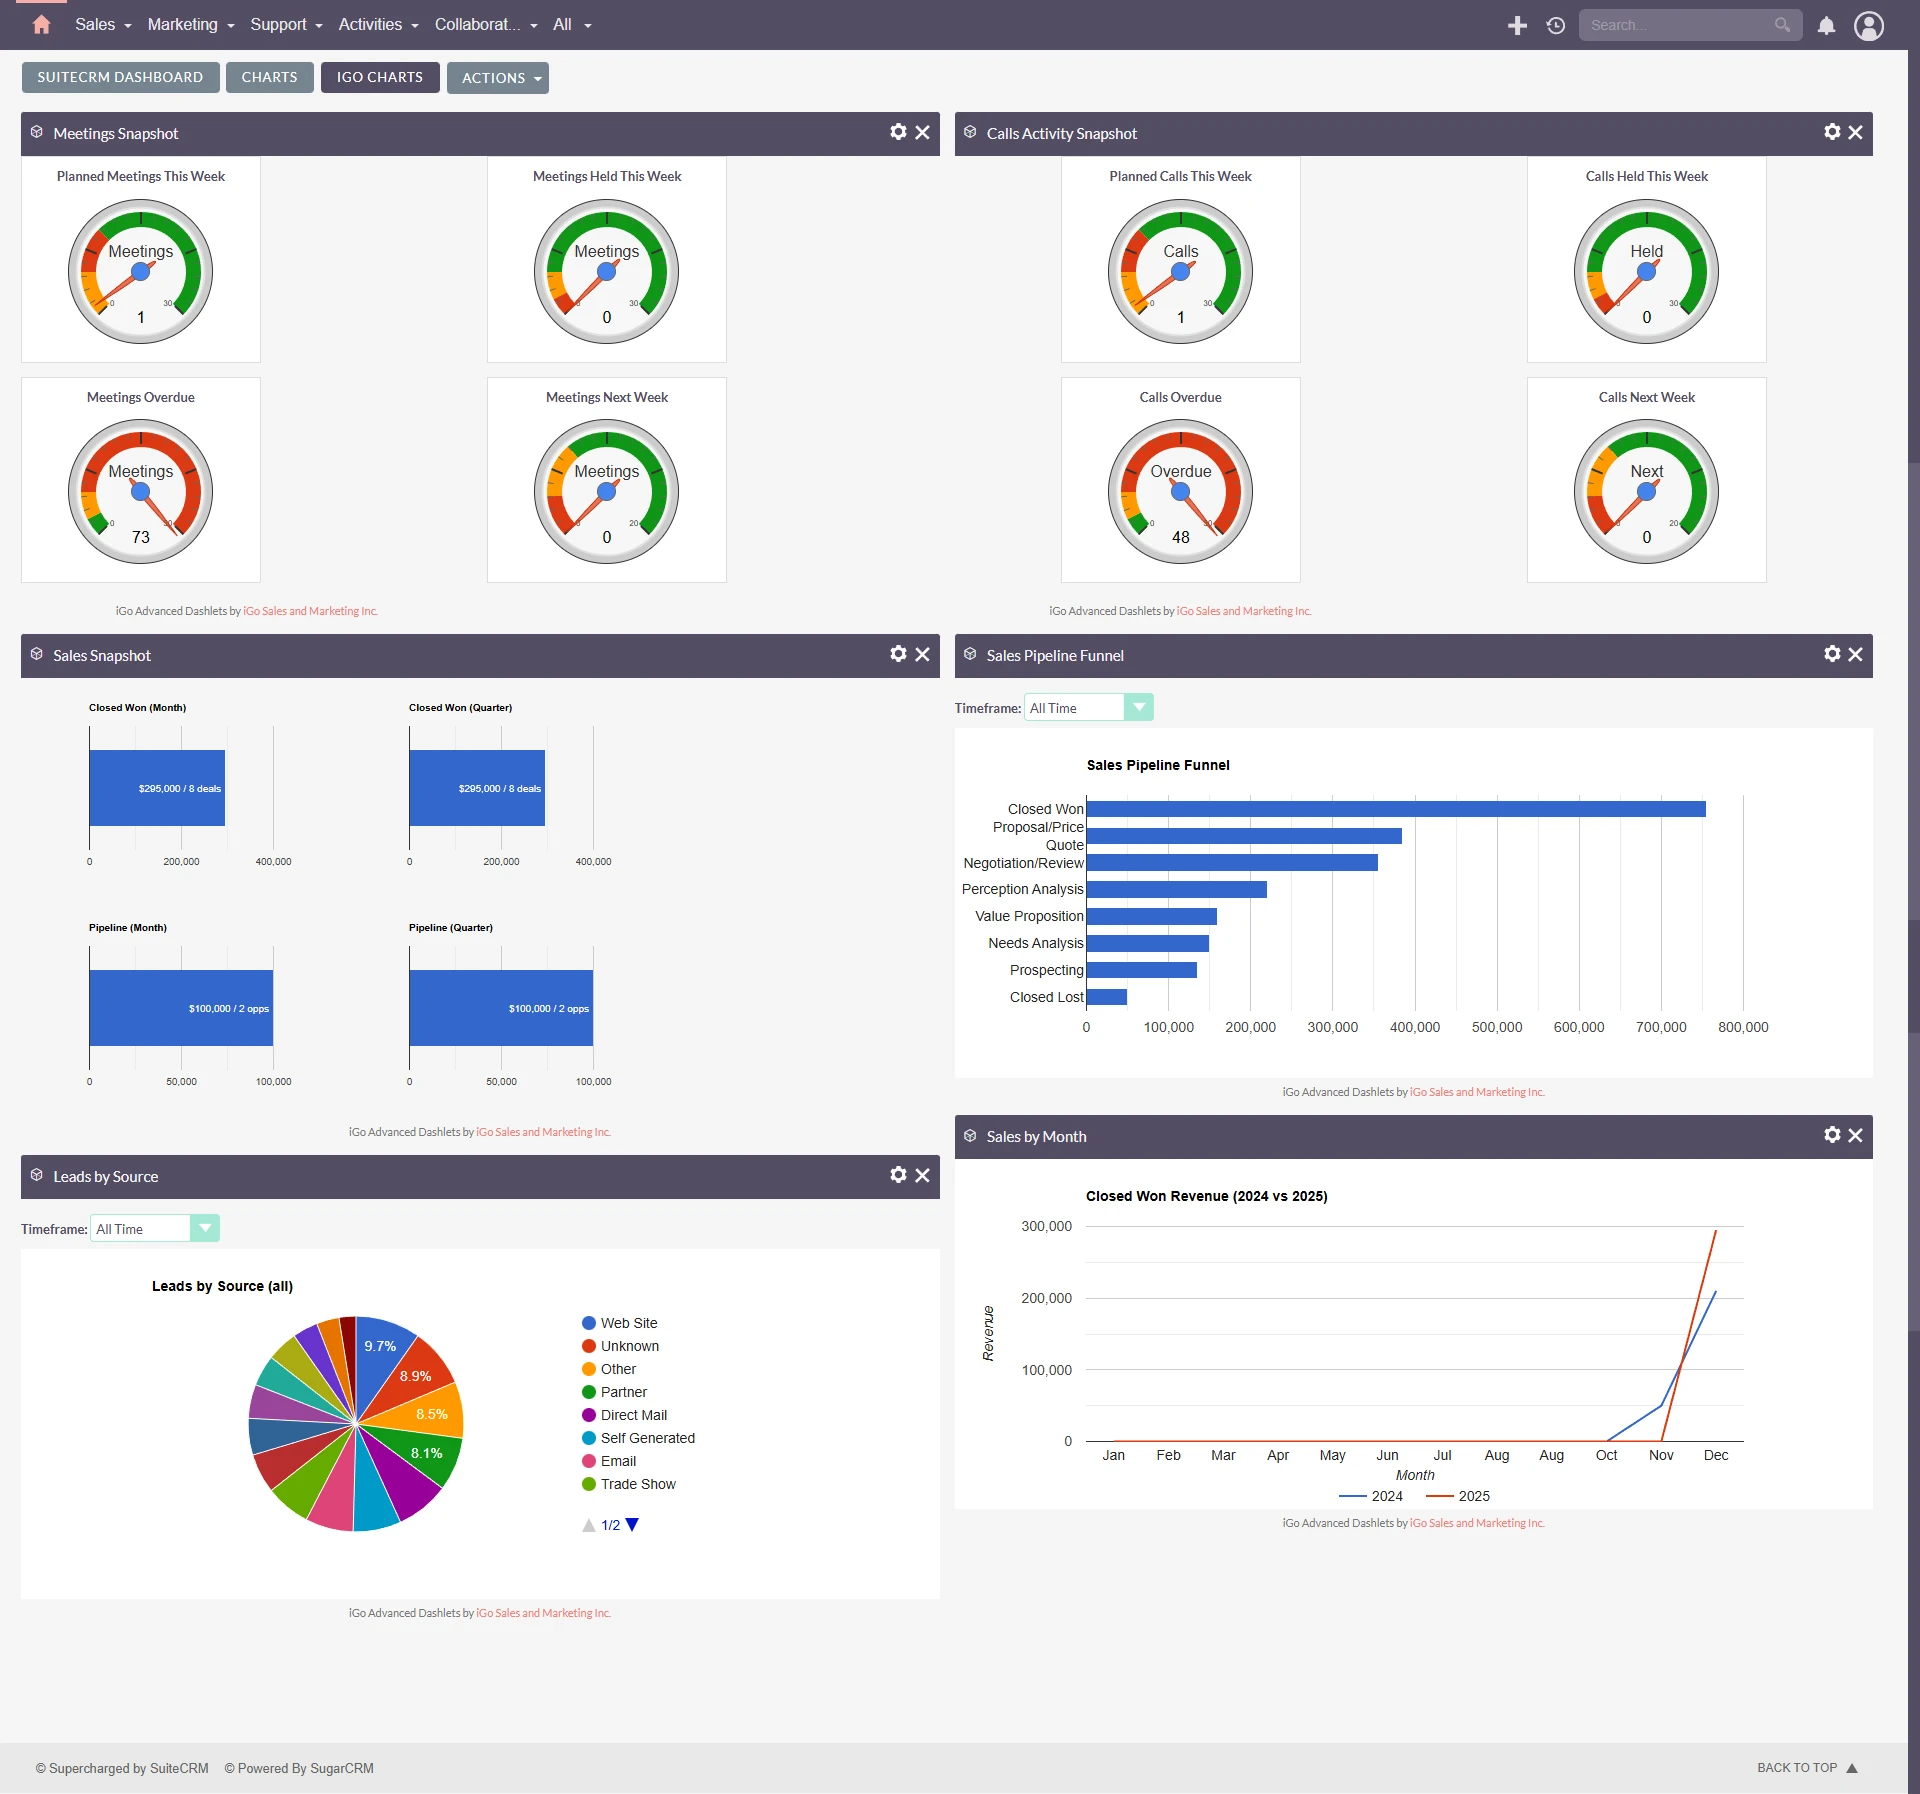
Instead of static reports, these dashboards provide visual, real-time insight into sales performance, directly on the SuiteCRM home screen.
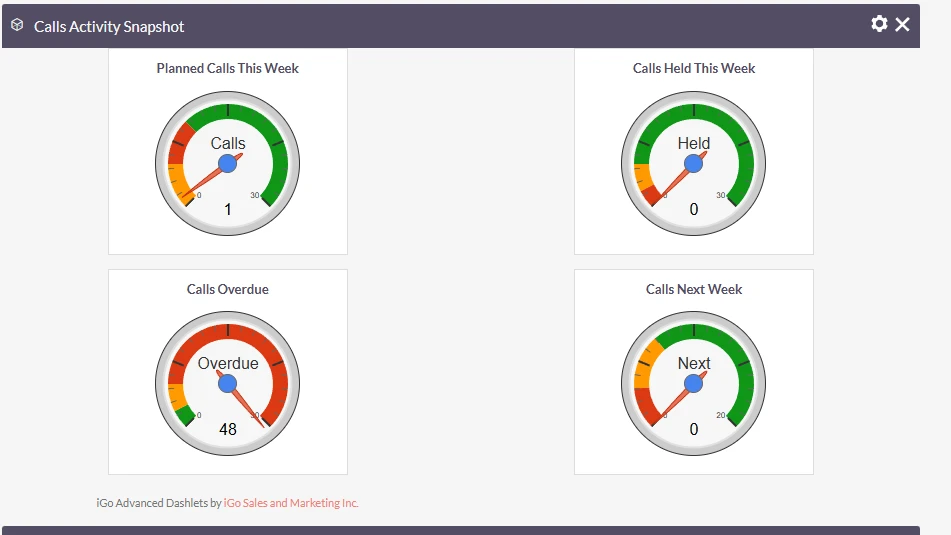
Activity Dashlets: Measuring Real Sales Effort (Not Just Call Counts)
One of the biggest blind spots in sales management is activity quality.
Counting calls alone doesn’t tell you:
- Were meetings actually held?
- Are reps following up?
- Is activity consistent week to week?
The Calls, Meetings, and Tasks Activity Dashlets are designed to answer exactly that.
These dashboards show:
- Calls held vs missed
- Meetings scheduled vs completed
- Tasks created and completed
- Time-based comparisons (this week, this month, this quarter)
Instead of chasing reps for updates, you get a clear, visual snapshot of whether the right sales behaviors are happening — without micromanagement.
This is especially useful for:
- Coaching conversations
- Identifying early pipeline risk
- Spotting activity drop-offs before revenue is impacted
Sales Snapshot: Pipeline vs Won Deals (Month & Quarter)
The Sales Snapshot Dashlet is the fastest way to answer one critical question:
Are we on track — and where are we heading?
In a single view, this dashboard compares:
- Closed-won deals
- Active pipeline value
- Monthly vs quarterly performance
This makes it easy to see:
- Whether current pipeline supports upcoming targets
- If deals are stalling instead of closing
- How this month compares to the broader quarter
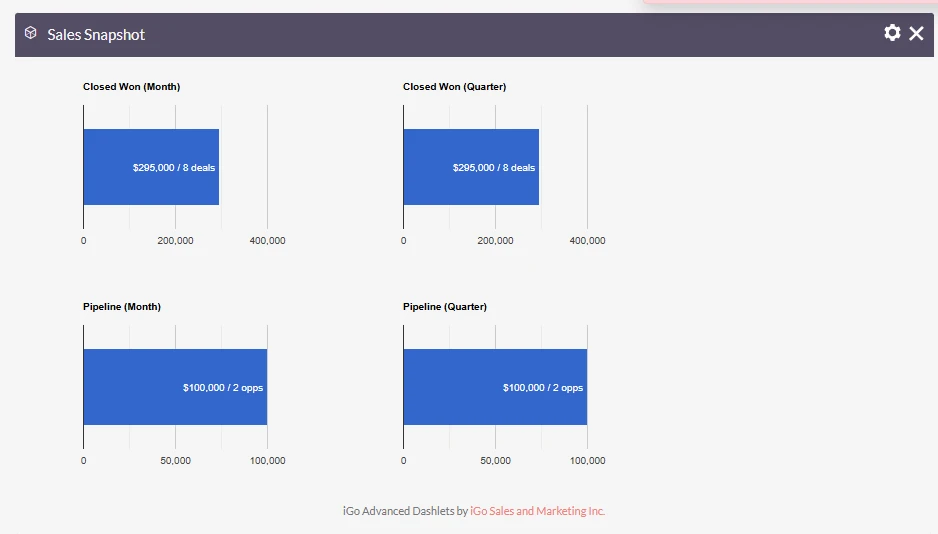
For sales managers and executives, this dashlet often becomes the default “morning check” — one glance, instant context.
Year-Over-Year Won Deals by Month
(A View SuiteCRM Reporting Doesn’t Make Easy)
One of the most requested insights from leadership is year-over-year performance.
SuiteCRM can technically produce this data, but it’s not easy to visualize — and rarely ends up being reviewed regularly.
This dashboard solves that by showing:
- Won deals by month
- Year-over-year comparisons
- Clear visual trends instead of spreadsheets
It’s ideal for:
- Executive reviews
- Planning discussions
- Understanding seasonality in your sales cycle
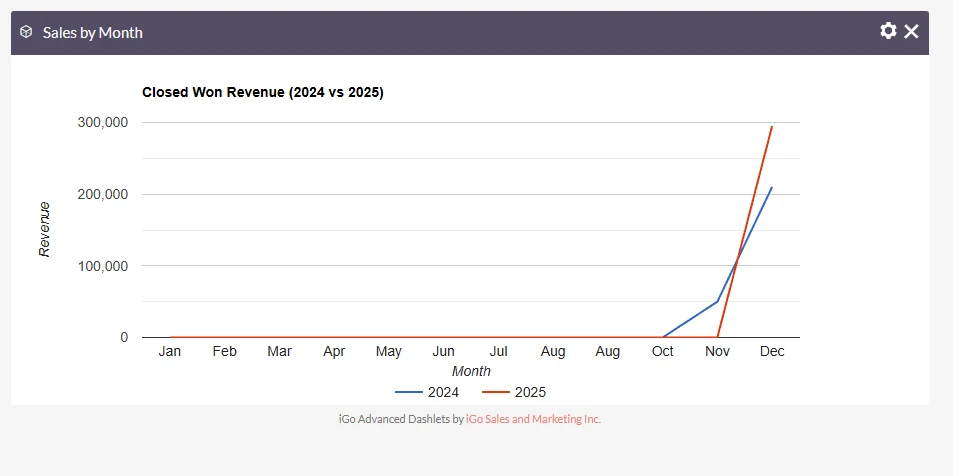
And because it’s visual, it encourages regular use, not once-a-quarter reporting.
Real-Time Funnel & Lead Source Dashboards
Two of the most powerful dashlets in this plugin are the Sales Funnel and Lead Source dashboards.
What makes them different is real-time interactivity.
Each includes a front-end time selector that allows you to instantly switch between:
- This week
- This month
- This quarter
- Year-to-date
- All time
There’s no page reload, no report editing, no admin steps.
This makes it easy to:
- Spot funnel changes as they happen
- See where leads are coming from right now
- Compare short-term vs long-term trends on demand

For sales managers, this turns dashboards into a daily decision tool, not a static report.
Built for Sales Leadership, Not Just CRM Admins
These dashboards are intentionally designed for:
- Sales managers
- Business owners
- Executives
They focus on:
- KPIs that drive revenue
- Visual clarity
- Minimal configuration
- Answers in seconds, not minutes
The free version provides immediate value out of the box.
A Pro version will introduce additional filtering options — such as viewing dashboards by individual sales rep or sales team — for organizations that need deeper segmentation.
But the core dashboards are designed to be useful on day one, without complexity.
Download the Plugin
If you want clearer visibility into sales activity, pipeline health, and performance trends, this plugin is a practical place to start.
https://igosalesandmarketing.com/services/igo-advanced-dashboards-for-suitecrm-free-edition/
No activation required.
Install, add the dashlets, and start seeing what your sales data is really telling you.
You can also reach out to me if your are looking for custom development of custom charts for your business
https://igosalesandmarketing.com/service/suitecrm-development/
Need help with SuiteCRM development?
I provide custom SuiteCRM development, customization, integrations, and technical support for businesses that need expert help.